Observability and Tracing for Retrieval Pipelines and Agent Memory
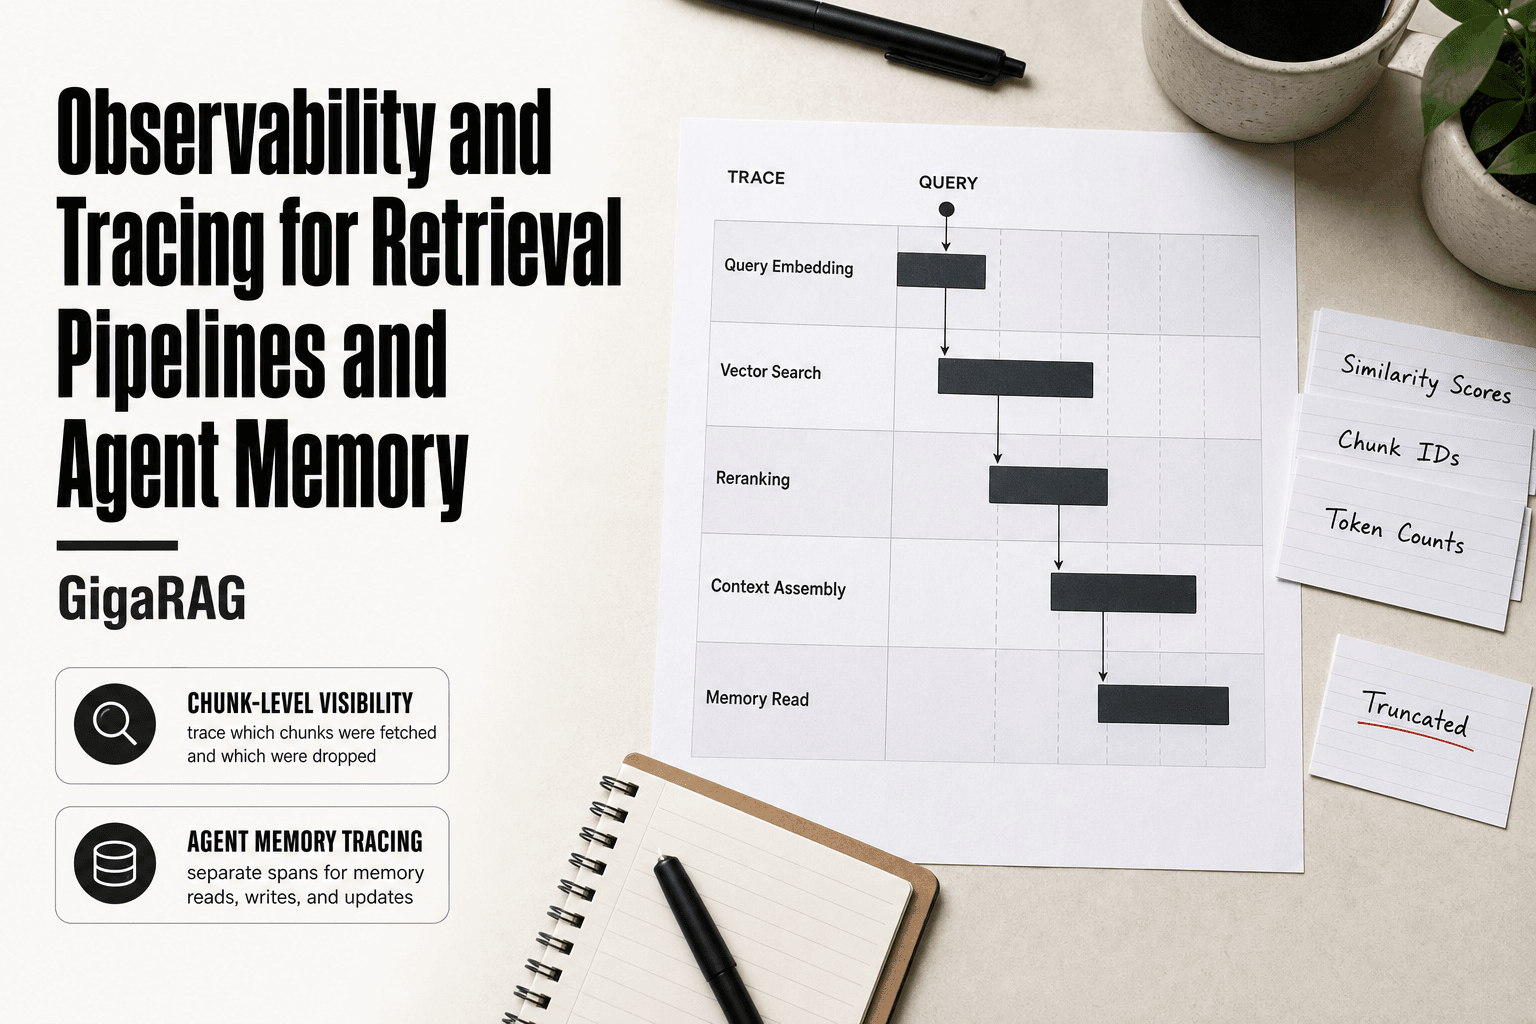
Your RAG pipeline returns a wrong answer, and you can't tell whether the retrieval step pulled bad chunks, the embedding lookup matched the wrong documents, or context assembly truncated the right ones before the LLM ever saw them. That's the failure mode most builders hit in production: the output is wrong, but the pipeline itself looks healthy. Observability and tracing for retrieval is how you open that black box. Tracing is not logging, and it's not monitoring. Logging records events. Monitoring tracks aggregate health. Tracing follows one request through every step, from query embedding to vector search to reranking to the final context that reaches the model. For retrieval pipelines and agent memory, that means seeing which chunks were fetched, which were dropped, and why. GigaRAG is built for exactly this: RAG pipeline builders and agent memory developers who need to debug retrieval in production, not just guess at it. This guide covers how to instrument a retrieval pipeline, what traces actually reveal, where agent memory tracing gets harder, and what observability cannot fix no matter how good your spans are.
| At a glance | Details |
|---|---|
| What it is | Tracing retrieval steps inside RAG and agent memory |
| Core unit | Spans for query, embed, search, rerank, assemble |
| Key metadata | Query text, top-k IDs, scores, latency, token counts |
| Main tools | OpenTelemetry, Langfuse, and similar LLM tracing tools |
| Biggest limit | It shows failures, it does not fix relevance |
| First step | Instrument one retrieval call end to end |
In This Guide
- What Is Observability and Tracing for Retrieval?
- Tracing Retrieval vs Tracing the Full LLM Call
- Why Retrieval Pipelines Fail Silently
- Observability And Tracing For Retrieval: A Step-by-Step Guide
- What to Trace in a Retrieval Pipeline
- Tracing Agent Memory Operations
- How to Get Started with Retrieval Tracing
- Common Mistakes When Setting Up Observability and Tracing for Retrieval
- What Observability Cannot Fix
- Choosing a Tracing Tool for Retrieval
What Is Observability and Tracing for Retrieval?
Observability means you can see inside a retrieval pipeline from its outputs alone. Tracing is the technique that makes that possible: it records each step of a retrieval call as a structured event with timing, inputs, and outputs attached.
Observability is the property of a system. Tracing is how you achieve it. Logging records events. Monitoring tracks metrics. Tracing connects them into a timeline.
Observability vs. monitoring vs. logging
Logging captures discrete events: "query received," "embedding generated." Monitoring aggregates those events into dashboards and alerts: p95 latency, error rate, token count. Tracing links events from a single request into one ordered sequence, so you can follow a query from embedding through vector search to context assembly and see where it went wrong. Logging tells you something happened. Monitoring tells you how often. Tracing tells you why.
Traces, spans, and sessions in retrieval context
A trace is the full record of one retrieval call. A span is one step inside that trace: the embedding lookup, the vector search, the rerank, the context assembly. A session groups multiple traces from one user conversation, so you can see how context carries across turns. In a RAG call, the trace starts when the query enters the pipeline and ends when the context is handed to the LLM.
Why retrieval needs its own tracing lens
General LLM tracing tools treat retrieval as a black box: query in, context out. But retrieval has its own failure modes that live inside that box. Embedding mismatch, wrong chunk selection, truncation, stale index. None of these show up in LLM output metrics. You need spans at the retrieval layer to see them.
[!note] Observability and tracing show you what your retrieval pipeline did, but they do not automatically improve relevance. Turning traces into better retrieval requires human review or an evaluation dataset to judge whether the retrieved documents were actually correct.
Tracing Retrieval vs Tracing the Full LLM Call
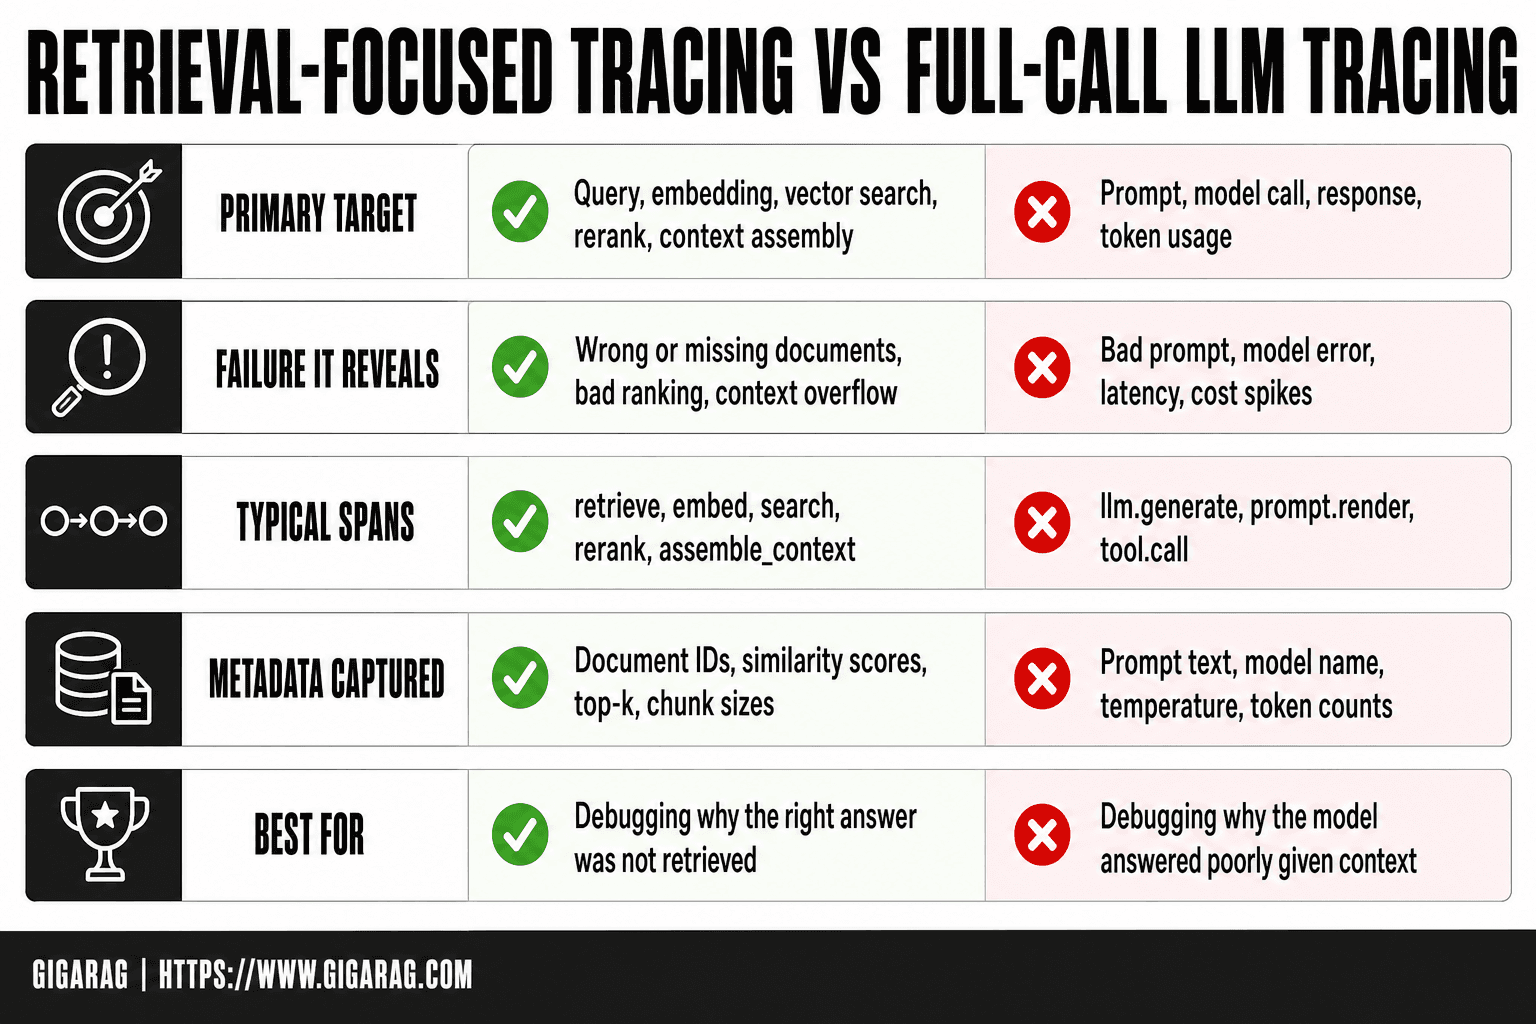
| Factor | Retrieval-focused tracing | Full-call LLM tracing |
|---|---|---|
| Primary target | Query, embedding, vector search, rerank, context assembly | Prompt, model call, response, token usage |
| Failure it reveals | Wrong or missing documents, bad ranking, context overflow | Bad prompt, model error, latency, cost spikes |
| Typical spans | retrieve, embed, search, rerank, assemble_context | llm.generate, prompt.render, tool.call |
| Metadata captured | Document IDs, similarity scores, top-k, chunk sizes | Prompt text, model name, temperature, token counts |
| Best for | Debugging why the right answer was not retrieved | Debugging why the model answered poorly given context |
Why Retrieval Pipelines Fail Silently
Most retrieval failures never throw an error. The pipeline returns something. It just returns the wrong thing, and the LLM happily builds an answer on top of it. You see a confident, fluent response and no signal that the evidence underneath was bad.
Embedding mismatch and semantic drift
Your query embedding and your document embeddings live in the same vector space, but they were trained on different data. Query embeddings drift as user language shifts: new slang, new product names, new ways of asking the same question. Document embeddings stay frozen until you re-embed. The gap between them grows quietly. Cosine similarity still returns results. They're just increasingly irrelevant results.
Wrong chunk selection and ranking failures
Vector search returns the top-k chunks by similarity score. But similarity is not relevance. A chunk can be semantically close to the query and still not answer it. Ranking failures happen when the retriever picks chunks that mention the right topic but miss the specific fact the user needs. The LLM then fills the gap with plausible-sounding text. You can't detect this from the final answer alone.
Context truncation and lost evidence
Context windows are finite. When you stuff too many chunks into the prompt, something gets cut. Often it's the chunk that actually contained the answer, because truncation happens by token count, not by relevance. The retriever found the right evidence. The assembler threw it away. The trace shows retrieval succeeded, but the answer is still wrong.
Stale index and missing documents
Your vector index is a snapshot. New documents don't appear until you re-index. Deleted documents linger until you remove them. If the answer depends on information that changed last week, a stale index returns last month's truth. The pipeline has no way to know it's outdated. It just retrieves what's there.
Agent memory retrieval failures
Agent memory adds another layer. The agent stores facts, preferences, and past interactions, then retrieves them later. Memory retrieval fails when the agent pulls the wrong memory, pulls an outdated memory, or misses a memory entirely. These failures compound: a wrong memory retrieved early in a conversation poisons every subsequent turn. Tracing memory operations is the only way to see which memory was fetched and why.
[!tip] For agent memory developers: trace memory reads, writes, and updates as separate spans with the memory key and version, so you can tell whether a wrong answer came from stale memory or from a bad retrieval query.
Observability And Tracing For Retrieval: A Step-by-Step Guide
- Create a parent span for the user request and give it a trace ID you can search later.
- Add a child span for query processing and record the raw query, any rewriting, and the final query text.
- Add a span for embedding and record the model name, vector dimensions, and embedding latency.
- Add a span for vector search and record the index name, top-k value, returned document IDs, and similarity scores.
- Add a span for reranking and record the reranker model, input count, output count, and score changes.
- Add a span for context assembly and record how many chunks were included, total token count, and any truncation.
- Attach the final prompt and response to the parent span, then export the trace to your observability backend.
What to Trace in a Retrieval Pipeline
You don't need to trace everything. You need to trace the five places where retrieval breaks. Each one gets its own span, and each span carries metadata that tells you what happened without forcing you to read the code.
Query embedding span
This span covers the moment your raw query becomes a vector. Capture the raw query text, the embedding model name and version, the embedding dimension, and the latency of the embedding call. The model version matters more than you'd think: when you swap embedding models, every downstream similarity score shifts. If you don't record which model produced the vector, you can't compare traces across the swap.
Vector search span
This span wraps the actual lookup in your vector database. Record the index name, the top-k value, the filter conditions if any, and the latency. Most importantly, capture the returned chunk IDs and their similarity scores. The scores are the first signal that something went wrong. If the top result scores 0.92 and the next scores 0.31, that's a cliff. If everything clusters around 0.45, the query may not match anything in the index.
Reranking span
Not every pipeline reranks, but if yours does, it needs its own span. Capture the reranker model name, the number of candidates passed in, the number returned, and the score changes. Reranking is where a chunk that vector search ranked seventh can jump to first. When the final answer is wrong, you need to know whether the reranker promoted the wrong chunk or the vector search never found the right one in the first place.
Context assembly span
This span covers what happens between retrieval and the LLM call. Record which chunks made it into the final prompt, in what order, and how many tokens each chunk consumed. Also record the total token count and whether anything was truncated. This is where good retrieval dies. The retriever finds the right chunk, the assembler drops it to fit the context window, and the LLM answers without it. Without this span, you can't tell the difference between a retrieval failure and an assembly failure.
Agent memory retrieval span
If your pipeline includes agent memory, trace memory reads separately from vector search. Capture the memory type (short-term, long-term, episodic), the query used to fetch the memory, the memory IDs returned, and their timestamps. Timestamps matter because stale memories are a distinct failure mode. A memory retrieved from three turns ago is different from one retrieved from three months ago. The span should make that difference visible at a glance.
Tracing Agent Memory Operations
Agent memory is not pipeline retrieval. It changes over time, and every change affects what the agent retrieves next. Tracing memory means capturing reads and writes as separate spans, with enough metadata to see how memory evolved.
Memory retrieval spans
A memory read span captures the query used to fetch memories, the memory type, the IDs returned, and their timestamps. Record the retrieval score if your memory store provides one. The key difference from vector search: memory retrieval is stateful. The same query can return different results depending on what was stored earlier in the session. The span needs to show that context.
Memory storage and update spans
Memory writes need their own spans. Capture the memory ID, the content written, the trigger for the write, and whether it created, updated, or deleted an entry. Updates are the dangerous ones. An agent that overwrites a memory silently changes what it will retrieve later. Without a write span, you can't reconstruct why the agent suddenly started answering differently.
Why memory tracing is harder than pipeline tracing
Pipeline tracing is stateless. The same query hits the same index and returns the same chunks. Memory tracing has to account for time. A memory written in turn five changes what turn ten retrieves. You need to correlate read spans with the write spans that preceded them. That means keeping session-level context across spans, not just span-level metadata. Most tracing tools handle this poorly because they were built for request-response pipelines, not stateful agents.
How to Get Started with Retrieval Tracing
You don't need a full observability platform to get value from tracing. Start with one retrieval call, capture the spans, and look at the trace. That's it. The rest is iteration.
Choose a tracing tool
Pick a tool that supports OpenTelemetry or has a Python SDK you can drop into your pipeline. Langfuse and Braintrust both work for retrieval tracing, though neither is built specifically for it. OpenTelemetry is the vendor-neutral option if you want to avoid lock-in. The main catch: OpenTelemetry requires more setup before you see your first trace. A managed tool gets you a UI faster.
What matters for retrieval is span nesting. Your vector search span needs to sit inside your query embedding span, and your context assembly span needs to sit after both. Not every tool renders nested spans well. Test that before committing.
Instrument the retrieval call
Wrap each retrieval step in a span. Here's tool-agnostic pseudo-code for a basic RAG call:
with tracer.start_span("retrieval") as span:
    with tracer.start_span("query_embedding") as embed_span:
        query_vector = embed(query)
        embed_span.set_attribute("embedding_model", "text-embedding-3-small")
        embed_span.set_attribute("embedding_dim", 1536)

    with tracer.start_span("vector_search") as search_span:
        chunks = vector_db.search(query_vector, top_k=5)
        search_span.set_attribute("top_k", 5)
        search_span.set_attribute("index_name", "docs_v2")
        search_span.set_attribute("results_returned", len(chunks))

    with tracer.start_span("context_assembly") as assembly_span:
        context = assemble_context(chunks, max_tokens=2000)
        assembly_span.set_attribute("chunks_used", len(chunks))
        assembly_span.set_attribute("context_tokens", count_tokens(context))
Each span records what happened and how long it took. The attributes are what make the trace useful later.
Capture spans and metadata
Don't skip the metadata. A span with no attributes tells you a step ran, not whether it ran well. Capture the query text, the embedding model, the index name, the number of results returned, and the latency of each step. For vector search, record the similarity scores of the top chunks. For context assembly, record how many chunks made it into the final prompt and how many tokens they consumed.
Keep attribute names consistent across spans. If you call it top_k in one place and k in another, filtering traces becomes a chore.
View and interpret the trace
Open the trace and read it top to bottom. The first thing to check is latency: which span took the longest? If vector search is 40ms and embedding is 800ms, your bottleneck is the embedding call, not the search. The second thing is results: did the search return the chunks you expected? If the top chunk has a similarity score of 0.42, that's your problem. The third thing is assembly: did all the relevant chunks make it into the context, or did truncation cut one?
A trace won't tell you the answer is wrong. It tells you where to look. That distinction matters more than most builders expect.
Common Mistakes When Setting Up Observability and Tracing for Retrieval
Most retrieval tracing setups fail for boring reasons. Not because the tool is wrong, but because the instrumentation is.
Tracing too much or too little
Tracing every function call creates noise. You can't find the retrieval failure in 400 spans. Tracing only the final LLM call hides the retrieval step entirely. The fix: trace the retrieval boundaries, not every line of code. Query embedding, vector search, reranking, context assembly. Four or five spans per call is enough.
Ignoring retrieval latency
Builders watch token usage and ignore milliseconds. That's backwards for retrieval. A vector search that takes 800ms when it should take 40ms is a real problem, and it compounds across every query. Record latency per span, not just total request time. You can't fix what you can't see.
Not capturing metadata
A span that says "vector_search ran" is useless. You need the query text, the index name, top_k, and similarity scores. Without those, you can't tell whether the search returned bad chunks or the embedding produced a bad query. Metadata is what turns a trace from a timeline into a debugging tool.
Confusing tracing with evaluation
Tracing shows you what happened. Evaluation tells you whether what happened was good. They are different jobs. A trace can reveal that the top chunk scored 0.42, but it won't tell you the answer was wrong. You need eval datasets and human review for that. Builders who expect traces to judge quality end up with pretty dashboards and no insight.
What Observability Cannot Fix
Tracing shows you where the pipeline broke. It does not fix the pipeline. That distinction gets lost in most vendor content, so let's be plain about it.
Tracing does not improve relevance
A trace records that the top chunk scored 0.42. It does not make the next query score 0.81. Relevance improves when you change the embedding model, adjust the chunking strategy, or tune the reranker. Tracing just tells you which of those changes moved the needle. Expecting traces to improve retrieval is like expecting a thermometer to lower a fever.
Tracing does not fix bad embeddings
If your embedding model maps "how do I reset my password" and "password policy for administrators" to nearly the same vector, tracing will show you the similarity score. It will not change the vectors. You need a better embedding model, a different distance metric, or a reranking step. The trace is the evidence, not the cure.
Tracing does not replace evaluation
This is the one builders resist most. A trace tells you what happened. It cannot tell you whether the answer was correct, helpful, or safe. That requires eval datasets, human review, or both. You can have perfect tracing on a pipeline that returns wrong answers every time. The dashboard will look great. The system will still fail.
Choosing a Tracing Tool for Retrieval
The tool matters less than the spans you capture. Langfuse, Braintrust, and OpenTelemetry all record traces. What separates them for retrieval work is how they handle nested spans, metadata search, and latency breakdowns.
Criteria for choosing a tracing tool
Check four things before you commit. First, does it let you attach arbitrary metadata to spans? Retrieval debugging lives in similarity scores, chunk IDs, and reranker ranks. If the tool only stores prompts and completions, it's useless for you. Second, does it support nested spans with clear parent-child relationships? A retrieval call has five layers. Flat traces hide the failure. Third, can you search traces by metadata, not just by timestamp? You'll want to filter for "similarity_score < 0.5" across a thousand traces. Fourth, what's the latency overhead? Some tools add 200ms per span. On a 400ms retrieval call, that doubles your cost.
Open source vs. managed options
OpenTelemetry is the standard for open source. It's vendor-neutral, but you'll build your own UI or pair it with something like Jaeger. Langfuse is open source with a managed tier, and it handles LLM spans natively. Braintrust is managed-first with strong eval tooling built in.
The honest answer: if you're instrumenting agent memory and RAG pipelines, pick a tool that treats retrieval spans as first-class, not as generic LLM calls. GigaRAG is built for exactly that: agent memory operations and retrieval pipeline builders who need chunk-level visibility, not just prompt-level traces.
Frequently Asked Questions
What is trace observability?
Trace observability is the practice of recording the full path of a request through a system as a set of connected spans. In retrieval pipelines, it means capturing each step from query to final context so you can see where a failure occurred.
What are the four pillars of observability?
The four pillars are typically logs, metrics, traces, and events. For retrieval pipelines, traces are the most useful because they show the sequence and timing of retrieval steps, while metrics and logs add aggregate and detail views.
What are the top 3 observability tools?
Common choices include OpenTelemetry for vendor-neutral instrumentation, Langfuse for LLM-specific tracing, and general APM platforms that support custom spans. The best tool depends on whether you need LLM-specific features or broad infrastructure coverage.
What are the three pillars of observability?
The three pillars are logs, metrics, and traces. Some teams add events as a fourth. For retrieval, traces are essential because they connect the query to the specific documents and scores returned.
How do I trace agent memory operations?
Create separate spans for memory retrieval, storage, and update operations. Record the memory key, the operation type, the data version, and the latency so you can distinguish memory failures from retrieval failures.
Can observability improve retrieval relevance automatically?
- Observability shows you what happened, but improving relevance requires human judgment or an evaluation dataset to decide whether the retrieved documents were correct. Traces are the input to that process, not a replacement for it.
What metadata should I capture in a retrieval span?
Capture the query text, the embedding model and dimensions, the index name, top-k, returned document IDs, similarity scores, reranker scores, and the final token count of the assembled context. This lets you reproduce and diagnose most retrieval failures.
About GigaRAG
GigaRAG is for agent memory and RAG pipeline builders. get this right. Whether you are working through observability and tracing for retrieval or something adjacent, we publish what we have actually tested, including where it falls short.