Pipeline Throughput: A Practical Guide for RAG and Agent Memory Builders
Search "pipeline throughput" and you'll get CPU architecture and crude oil. What you won't get is anyone explaining what throughput means when your pipeline moves embeddings, retrieved chunks, and generated tokens, and why that number decides whether your users wait 200 milliseconds or 3 seconds for an answer.
This guide is for the engineer who has to make that call. GigaRAG is built for exactly this audience, but you don't need it to understand the fundamentals here. What you need is a working definition, a measurement method you can run on your own stack, and a short list of levers that actually move the needle. You'll get all three.
The honest answer is that most optimization effort gets spent on the wrong stage. This guide covers what pipeline throughput means in RAG terms, how to measure it with percentiles instead of averages, which improvements actually help, and what you cannot expect no matter how much you tune.
| At a glance | Details |
|---|---|
| Core Definition | Rate of queries or tokens processed per second |
| Key Units | QPS, tokens/sec, end-to-end latency |
| Main Levers | Batching, caching, model choice, retrieval speed |
| Trade-off | Higher throughput often increases latency |
| Hard Ceiling | Limited by slowest stage (bottleneck) |
| Measurement | Instrument each stage; track percentiles |
In This Guide
- What Is Pipeline Throughput?
- Throughput vs Latency in RAG Pipelines
- The Stages of a RAG Pipeline (and Where Time Actually Goes)
- Pipeline Throughput: A Step-by-Step Guide
- Throughput vs. Latency: The Trade-Off You Can't Avoid
- How to Measure Pipeline Throughput in a RAG System
- Practical Ways to Improve Pipeline Throughput
- What You Cannot Do: Honest Limitations of Throughput Optimization
- Common Mistakes When Optimizing Pipeline Throughput
- Final Thoughts on Pipeline Throughput for RAG Builders
What Is Pipeline Throughput?
Pipeline throughput is the amount of work a pipeline completes per unit of time. For RAG and agent memory systems, that means queries per second, tokens per second, or chunks retrieved per query.
The general definition: work completed per unit of time
Throughput measures volume over time. A pipeline that handles 50 queries per second has twice the throughput of one handling 25. It's not about how fast any single query finishes. It's about how many finish in a given window.
What throughput means in a RAG pipeline: queries per second, tokens per second, chunks retrieved per query
In practice, you'll track three numbers. Queries per second tells you how many end-to-end requests your system serves. Tokens per second measures LLM inference speed during generation. Chunks retrieved per query captures retrieval breadth, which directly affects context quality and cost.
Why throughput matters more than raw speed for production systems
Raw speed is one query's latency. Throughput is what your users actually experience when ten, fifty, or five hundred people hit the system at once. A pipeline that's fast for one user but collapses under load isn't fast in production.
[!note] Pipeline throughput in RAG is not just about tokens per second—it also depends on retrieval speed and memory access patterns, which are often the hidden bottleneck.
Throughput vs Latency in RAG Pipelines
| Factor | Throughput | Latency |
|---|---|---|
| Definition | Queries or tokens processed per unit time | Time to process a single query end-to-end |
| Primary Goal | Maximize volume handled | Minimize response time per query |
| Typical Optimization | Increase batch size, parallelize stages | Reduce batch size, use faster models, cache |
| User Experience Impact | Affects capacity and cost | Affects perceived speed and interactivity |
| Trade-off | Larger batches can increase latency | Lower latency may reduce throughput |
The Stages of a RAG Pipeline (and Where Time Actually Goes)
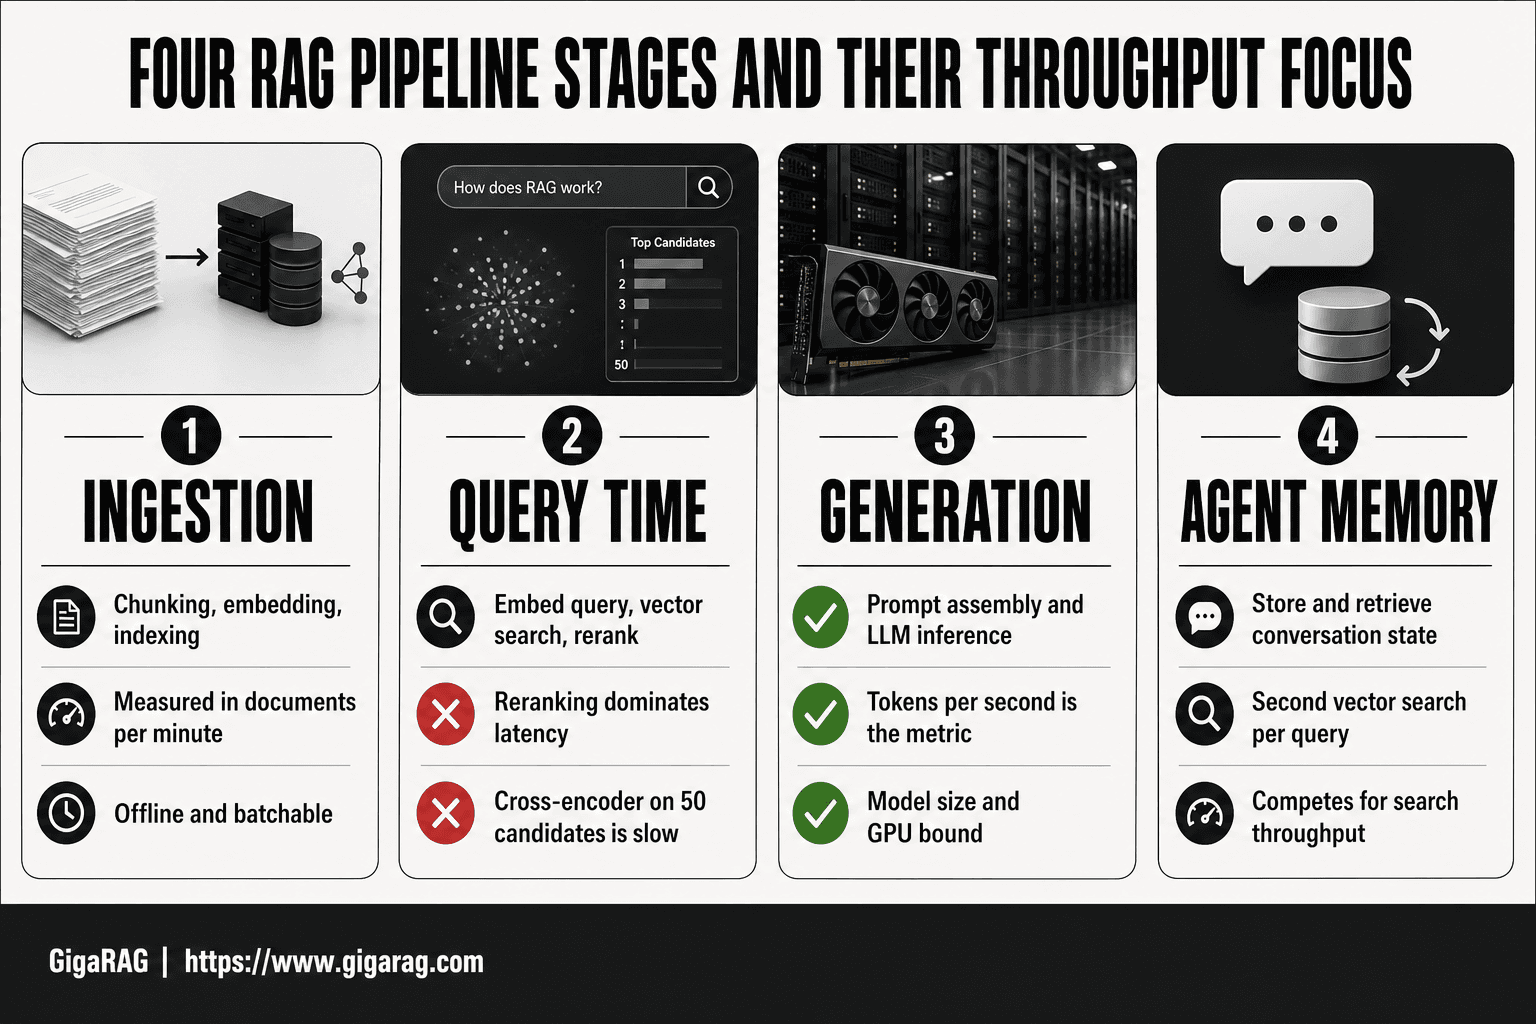
A RAG pipeline has four stages. Each one eats time differently, and knowing which stage is your bottleneck is the whole game.
Ingestion: chunking, embedding, and indexing
Ingestion happens before any user query arrives. You split documents into chunks, run each chunk through an embedding model, and store the vectors in an index. This stage is measured in documents per minute or chunks per second. It's slow, but it's offline. You can batch it, parallelize it, and run it overnight.
Query time: embedding the query, vector search, reranking
This is where latency lives. You embed the user's query, search the vector index for similar chunks, and optionally rerank the results with a cross-encoder. Vector search is fast. Reranking is not. A cross-encoder reranking 50 candidates can take longer than the initial search across a million vectors.
Generation: prompt assembly and LLM inference
You stuff the retrieved chunks into a prompt and send it to the LLM. Inference time dominates here. Tokens per second is your metric, and it's mostly a function of model size and GPU availability. Prompt assembly is cheap. Token generation is the expensive part.
Agent memory: storing and retrieving conversation state
Agents add a fourth stage. Every turn writes to memory, and every new query reads from it. Memory retrieval is essentially a second vector search, which means it doubles your retrieval cost per query. If your memory store shares an index with your knowledge base, you're competing for the same search throughput.
[!tip] For agent memory systems, cache frequently accessed embeddings and retrieved chunks at the edge to cut latency and boost throughput without expensive model changes.
Pipeline Throughput: A Step-by-Step Guide
- Define your units: decide whether you care about queries per second, tokens per second, or both, and set a target.
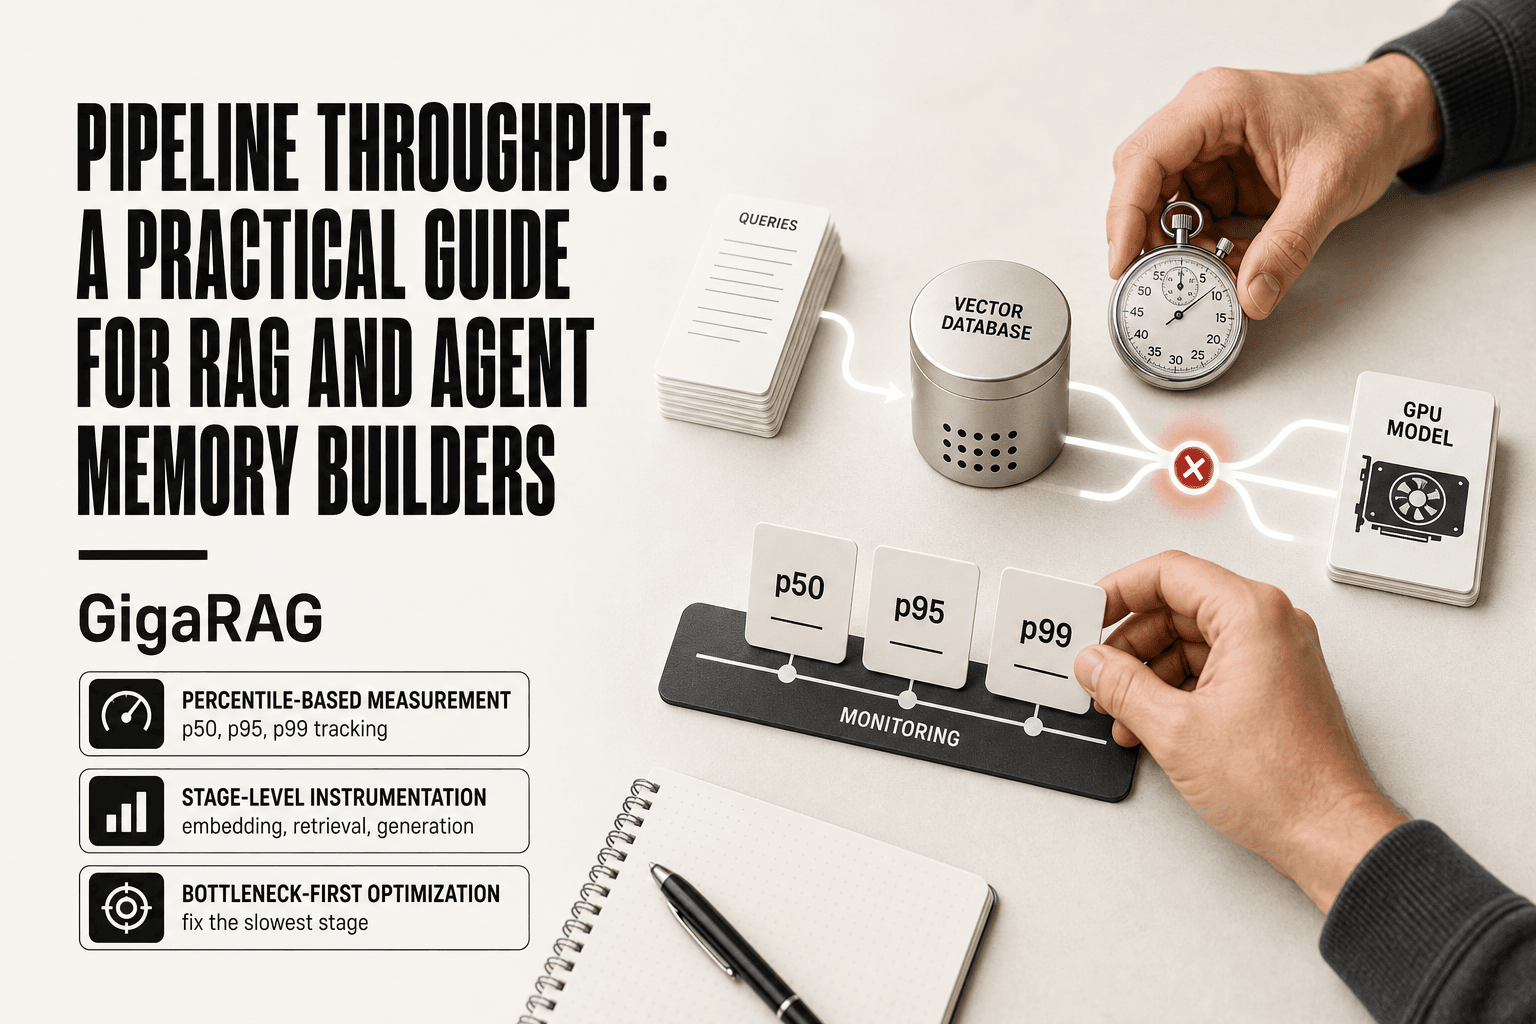
- Instrument each stage: add timing and counters for embedding, retrieval, reranking, and generation.
- Run a load test: send a realistic mix of queries at increasing concurrency and record throughput and latency percentiles.
- Identify the bottleneck: find the stage with the lowest throughput or highest latency contribution.
- Optimize the bottleneck: apply targeted fixes like batching, caching, or model swapping, then re-measure.
- Monitor in production: track throughput and latency continuously to catch regressions and plan capacity.
Throughput vs. Latency: The Trade-Off You Can't Avoid
Throughput and latency pull in opposite directions. You can't maximize both. Pick one.
Definitions: throughput is volume over time, latency is time per unit
Throughput is how much work finishes in a window: queries per second, tokens per second, chunks embedded per minute. Latency is how long one unit takes from start to finish. A pipeline handling 100 queries per second can still have 2-second latency per query if it runs 200 queries in parallel.
Why batching improves throughput but hurts latency
Batching amortizes overhead. One embedding call for 100 chunks costs less total time than 100 separate calls. But the first chunk in that batch waits for the batch to fill. A batch size of 64 means the first query sits idle until 63 more arrive. Your throughput climbs. Your p50 latency climbs with it.
How to decide which to prioritize for your use case
It depends on what your user experiences. Interactive chat needs latency under 500ms per turn. Batch ingestion of a document corpus needs throughput. If you're building an agent that answers live questions, optimize latency and accept lower throughput. If you're indexing a knowledge base overnight, optimize throughput and ignore latency entirely.
How to Measure Pipeline Throughput in a RAG System
Stop guessing. Instrument the stages, record the numbers, do the math.
What to instrument: embedding time, vector search time, LLM inference time, total query time
Wrap each stage in a timer. Log embedding time for the query, vector search time against your index, LLM inference time for generation, and total query time end to end. Four numbers per query. That's it.
The formula: throughput = total queries / total time (and why averages lie)
Run 1,000 queries through your pipeline. Record total wall-clock time. Divide. If 1,000 queries finish in 50 seconds, throughput is 20 queries per second.
Averages lie because one slow query drags the mean. A p50 of 200ms with a p99 of 4 seconds means most users are fine but some wait forever.
Using percentiles (p50, p95, p99) to understand real-world throughput
Sort all query times. p50 is the middle. p95 is the 950th of 1,000. p99 is the 990th. Report all three. If p99 is 10x your p50, you have a tail latency problem, not a throughput problem.
A simple example with sample numbers
100 queries. Total time 10 seconds. Throughput: 10 queries per second. Stage breakdown: embedding 80ms average, vector search 15ms, LLM inference 900ms. The LLM is 90% of your time. Optimize that first.
Practical Ways to Improve Pipeline Throughput
Start with the bottleneck you measured. If LLM inference is 90% of query time, no amount of vector search tuning will help. Fix that first.
Reduce embedding cost: smaller models, caching, batch embedding
Swap a 768-dimension model for a 384-dimension one. Embedding time drops roughly in half, and vector search gets faster too. Cache embeddings for repeated chunks and queries. Batch embedding during ingestion: 100 chunks at once beats 100 single calls.
Speed up vector search: index type, dimensionality reduction, approximate nearest neighbors
HNSW indexes trade a little recall for much faster search. Flat indexes are exact but slow. If you can accept 95% recall instead of 100%, approximate nearest neighbors cuts search time by 10x or more. Dimensionality reduction via PCA or product quantization shrinks the index and speeds up distance math.
Cut LLM inference time: shorter prompts, streaming, smaller models
Every token in the prompt costs time. Trim system prompts and retrieved context. Stream tokens so users see output before generation finishes. A 7B model generates 2-3x faster than a 70B model. If your task doesn't need the big model, don't use it.
Parallelize independent stages: ingestion vs. query time
Ingestion and query time are separate workloads. Run them on separate processes or machines. Embedding chunks for tomorrow's index shouldn't compete with today's user queries for GPU.
Cache aggressively: query results, embeddings, and retrieved chunks
Cache query results for repeated questions. Cache embeddings for chunks you've already processed. Cache retrieved chunks so identical searches skip vector search entirely. A cache hit is 100x faster than a full pipeline run.
What You Cannot Do: Honest Limitations of Throughput Optimization
Optimization has hard ceilings. You can't push past what your hardware allows, and you can't buy back time the physics of your stack already spent.
Hardware ceilings: GPU memory, network bandwidth, disk I/O
Your GPU holds a fixed number of tokens in memory. When the batch fills it, throughput stops scaling no matter what you tune. Network bandwidth caps how fast chunks move between services. Disk I/O caps ingestion speed. These are walls, not dials.
Diminishing returns: why the last 10% of optimization costs 90% of the effort
The first changes you make, smaller embeddings, caching, approximate search, give you most of the gain. After that, each improvement gets smaller and costs more engineering time. Chasing the final 10% usually isn't worth it.
The throughput-latency trade-off revisited: you can't have both
Batching raises throughput and hurts latency. Streaming helps latency and lowers throughput. Pick one per workload. You can't optimize both at once.
Why adding more stages (reranking, memory) always costs throughput
Every stage you add, reranking, memory retrieval, extra validation, adds time to each query. That's the cost of better answers. You pay it knowingly or you don't pay it at all.
Common Mistakes When Optimizing Pipeline Throughput
Most throughput problems come from fixing the wrong thing. You measure one stage, tune it, and nothing changes because the bottleneck was somewhere else.
Optimizing the wrong stage (e.g., vector search when LLM inference is the bottleneck)
Profile first. If LLM inference takes 80% of query time, speeding up vector search by 20% moves total throughput by 4%. Fix the stage that dominates.
Measuring averages instead of percentiles
Averages hide tail latency. Your p50 looks fine while p99 queries time out. Track p95 and p99.
Ignoring ingestion throughput in favor of query throughput
Users feel query speed. Your index freshness depends on ingestion. A slow ingestion pipeline means stale answers, which costs more than latency.
Over-batching and destroying latency
Bigger batches raise throughput until they don't. Past a point, latency spikes and users leave.
Final Thoughts on Pipeline Throughput for RAG Builders
You can't optimize what you haven't measured, and you can't measure what you haven't instrumented. That's the whole game. Profile each stage, fix the bottleneck, track percentiles, and stop when the gains stop paying for the effort.
The honest ceiling is hardware. Past a certain point, more tuning just moves the problem around. Know when to stop.
If you're building a RAG or agent memory pipeline and want pipeline throughput numbers without wiring up instrumentation by hand, GigaRAG is built for this audience. It measures pipeline throughput across ingestion, retrieval, and generation out of the box. Not a magic fix. Just less setup.
Start with one pipeline. Instrument it. Measure p95. Fix the slowest stage. Then move on.
Frequently Asked Questions
What is pipeline throughput?
In RAG and agent systems, pipeline throughput is the rate at which your pipeline processes queries or generates tokens, typically measured in queries per second (QPS) or tokens per second. It reflects how much work your system can handle over time.
What is throughput in simple terms?
Throughput is how much stuff your system can push through in a given time. For a RAG pipeline, that could be the number of user queries answered per second or the number of tokens generated per second.
What are the 5 stages of a pipeline?
In a RAG pipeline, the stages are typically: query embedding, vector retrieval, reranking, context assembly, and LLM generation. Each stage can become a bottleneck that limits overall throughput.
What is latency and throughput in pipelining?
Latency is the time it takes for a single query to complete from start to finish. Throughput is how many queries or tokens the system can process per unit time. They are related: increasing throughput by batching often increases latency.
How do I measure throughput in a RAG pipeline?
Instrument each stage with timers and counters, then run load tests at different concurrency levels. Measure queries per second and tokens per second, and track latency percentiles to understand the full picture.
What limits pipeline throughput?
The slowest stage in your pipeline—often the LLM generation or vector retrieval—sets the ceiling. Hardware, model size, batch size, and network latency also impose hard limits.
Can I improve throughput without hurting latency?
Sometimes, by optimizing the bottleneck stage (e.g., using a faster model or caching). But often there is a trade-off: increasing batch size for throughput can increase latency. Measure both to find the right balance.
About GigaRAG
GigaRAG is for agent memory and RAG pipeline builders. get this right. Whether you are working through pipeline throughput or something adjacent, we publish what we have actually tested, including where it falls short.